Denis - The COVID info guy -

Denis - The COVID info guy -

@bigbaddenis · Twitter ·

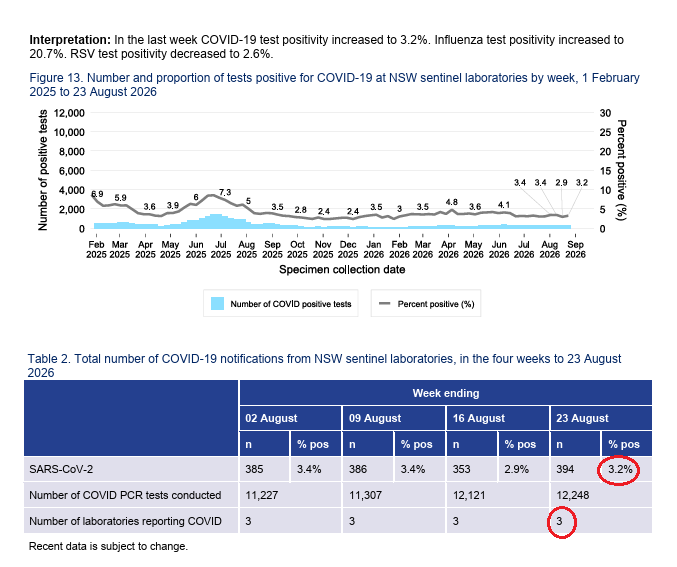
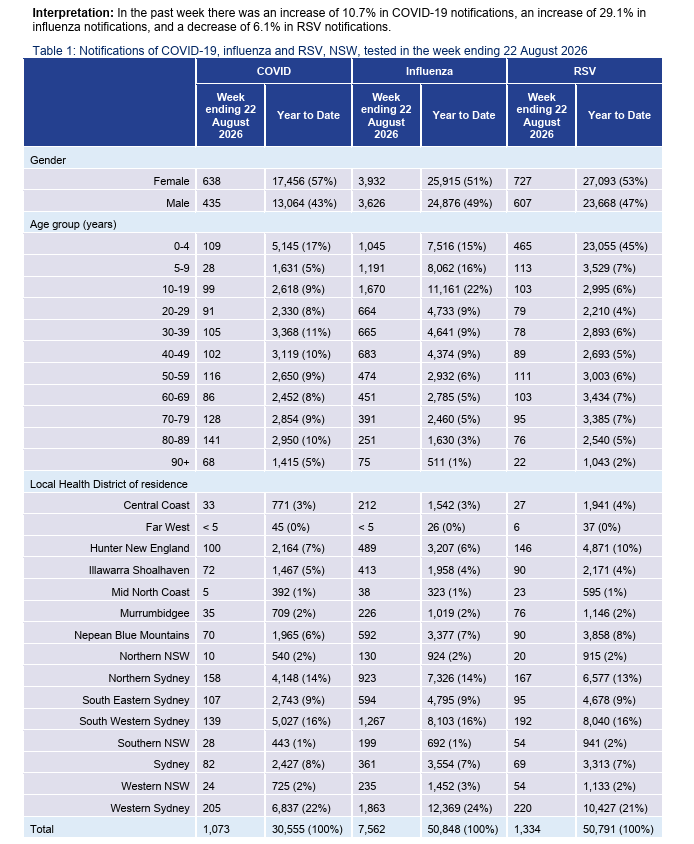
🧵(1/3) NSW respiratory surveillance reports: 27 August 2026 Week ending 22 Aug 2026: 🔸COVID positivity rate: 3.2% (+0.3%) 🔸Number of laboratories reporting COVID: 3 out of 4 🔹COVID: 1,073 (+10.7%) 🔹Influenza: 7,562 (+29.1%) 🔹RSV: 1,334 (-6.1%) https://health.nsw.gov.au/Infectious/covid-19/Pages/reports.aspx

A screenshot of the NSW Respiratory Surveillance Report for the week ending 22 August 2026 from the NSW Government website.
A prominent box at the top highlights: "Influenza is at a high level of activity. COVID-19 is at a low level of activity. RSV is at a moderate level of activity."
The "Summary" section below repeats these activity levels, noting that influenza activity continues to increase, and states that influenza vaccination is strongly recommended while RSV vaccines for older adults are now available.
The "Data sources and methods" section explains how NSW Health monitors respiratory viruses using surveillance data, wastewater programming, genomic sequencing, and sentinel laboratory results. It notes that public registration of positive COVID-19 rapid antigen tests (RAT) in NSW ceased on 30 September 2023, and mentions that outbreaks in residential aged care homes are still monitored. A link is provided at the bottom for further methodology details.
A screenshot of Table 1 from a NSW health report, titled "Notifications of COVID-19, influenza and RSV, NSW, tested in the week ending 22 August 2026."
An introductory text at the top states that in the past week, there was an increase of 10.7% in COVID-19 notifications, an increase of 29.1% in influenza notifications, and a decrease of 6.1% in RSV notifications.
The table breaks down positive cases by Week ending 22 August 2026 and Year to Date columns across three viruses: COVID, Influenza, and RSV. Data rows are categorized under three main headers:
•	Gender: Shows cases for Female and Male demographics.
•	Age group (years): Breaks down cases into ten-year cohorts from 0-4 up to 90+.
•	Local Health District of residence: Lists case counts across 15 regional health districts, including Northern Sydney, South Western Sydney, and Western Sydney.
The Total row at the bottom shows weekly counts of 1,073 for COVID, 7,562 for Influenza, and 1,334 for RSV.

A screenshot displaying Figure 6, titled "Weekly notifications of COVID-19, Influenza and RSV, by date of test and type of test performed, NSW, 1 February 2025 to 22 August 2026."
The image features three stacked bar charts tracking weekly respiratory cases over an 18-month timeline:
•	COVID-19 (Top): Shows a massive peak of ~4,000 weekly cases around July 2025, followed by a steady drop and low baseline plateau fluctuating between 500 and 1,200 cases throughout 2026.
•	Influenza (Middle): Shows a peak of ~8,500 cases in July 2025, a winter drop, and a dramatic, steep spike in cases approaching 8,000 in August 2026. The bars are color-coded by test type, revealing a dominant majority of dark blue "Influenza - Type A" cases.
•	RSV (Bottom): Displays a double-peak pattern. Cases reached ~3,200 in June 2025 and hit a slightly lower peak of ~3,000 cases in June 2026, steadily declining through July and August 2026.
A screenshot displaying data on COVID-19 test positivity from NSW sentinel laboratories, tracking data from 1 February 2025 to 23 August 2026.
An introductory text note states that in the past week, COVID-19 test positivity increased to 3.2%, influenza increased to 20.7%, and RSV decreased to 2.6%.
The image features two data visualizations:
•	Figure 13 (Top): A dual-axis chart combining light blue bars representing the "Number of COVID positive tests" and a grey line showing the "Percent positive (%)". The line shows a peak of 7.3% in July 2025, a drop to a low of 2.4% in December 2025, and a recent slight rise back to 3.2% in August 2026.
•	Table 2 (Bottom): Breaks down SARS-CoV-2 metrics across four weeks ending in August 2026. The row for SARS-CoV-2 shows the weekly positive cases and percent positive values. For the final week ending 23 August, a red circle highlights a 3.2% pos rate out of 12,248 tests conducted across 3 reporting laboratories.