Denis - The COVID info guy -

Denis - The COVID info guy -

@bigbaddenis · Twitter ·

🧵US Weekly COVID update: Sep 7, 2026 🔸1 in 86 Actively Infectious 🔸567,000 Daily Infections 🔸3,690,000 Infections In The Past Week 🔸103,000,000 Infections in 2026 🔸185,000 to 740,000 Weekly Long COVID Cases 🔸900 to 1,600 Weekly Excess Deaths https://pmc19.com

A color-coded COVID-19 US Heat Map from the Pandemic Mitigation Collaborative (PMC) Model, dated September 7, 2026. The graphic states that the US has at least 33 states/territories with COVID outbreaks.
The map uses five colours to display relative CDC levels and PMC prevalence estimates:
•	Very Low (<0.9%): Light green
•	Low (1.2%): Yellow-green
•	Moderate (2.0%): Orange
•	High (2.9%): Pink
•	Very High (>3.5%): Purple
Large sections of the South, West Coast, Midwest, and Northeast are heavily shaded in pink and purple, indicating high to very high transmission levels.
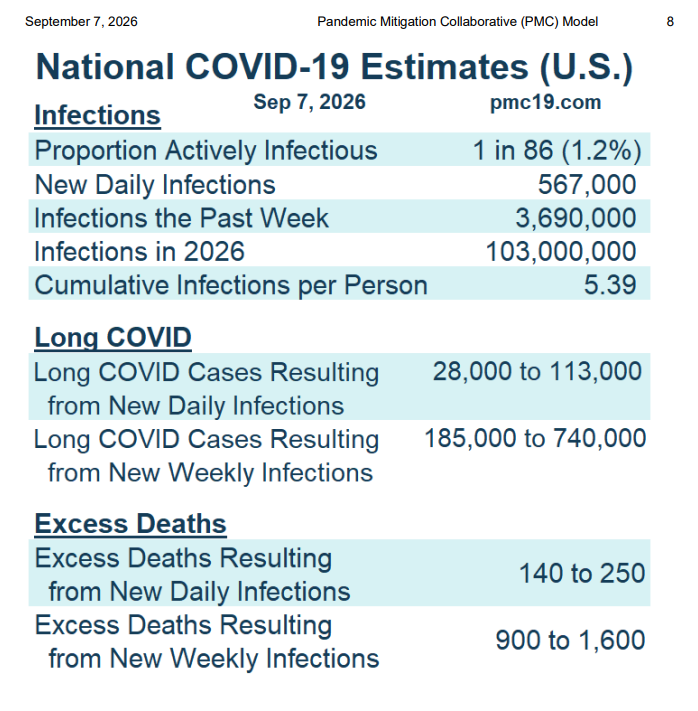
The text lists 33 affected areas including Alaska, Hawai'i, Guam, Puerto Rico, US Virgin Islands, Washington, Oregon, California, Nevada, Arizona, New Mexico, Montana, Colorado, Texas, Louisiana, Mississippi, Alabama, Georgia, Florida, Arkansas, Missouri, Illinois, Indiana, Kentucky, Tennessee, Michigan, Ohio, North Carolina, Virginia, West Virginia, Pennsylvania, Connecticut, and Rhode Island. Watermarks note pmc19.com A text-based data chart titled "National COVID-19 Estimates (U.S.)" from pmc19.com, dated Sep 7, 2026. It lists modelled statistical estimates broken down into three categories:
Infections
•	Proportion Actively Infectious: 1 in 86 (1.2%)
•	New Daily Infections: 567,000
•	Infections the Past Week: 3,690,000
•	Infections in 2026: 103,000,000
•	Cumulative Infections per Person: 5.39
Long COVID
•	Long COVID Cases Resulting from New Daily Infections: 28,000 to 113,000
•	Long COVID Cases Resulting from New Weekly Infections: 185,000 to 740,000
Excess Deaths
•	Excess Deaths Resulting from New Daily Infections: 140 to 250
•	Excess Deaths Resulting from New Weekly Infections: 900 to 1,600
The chart features an alternating white and light-blue row format for readability, with page number 8 in the top right corner.
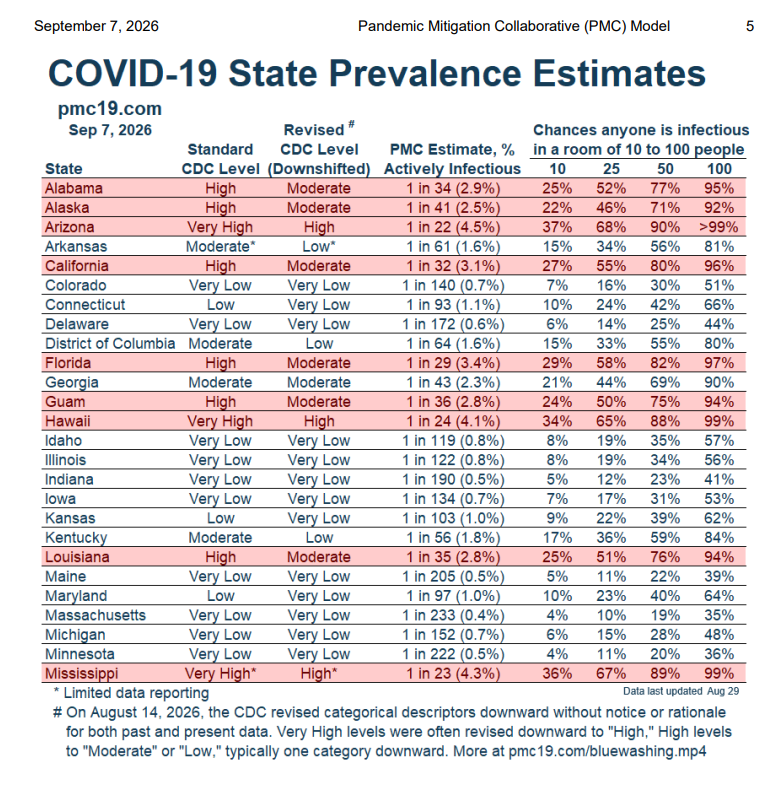
A data table titled "COVID-19 State Prevalence Estimates" from pmc19.com, dated Sep 7, 2026 (page 5). It ranks states alphabetically, comparing standard CDC levels against revised levels and active infection odds.
Selected State Metrics (State | CDC Level | PMC Active Infection Odds):
•	Alabama: High | 1 in 34 (2.9%)
•	Alaska: High | 1 in 41 (2.5%)
•	Arizona: Very High | 1 in 22 (4.5%)
•	California: High | 1 in 32 (3.1%)
•	Florida: High | 1 in 29 (3.4%)
•	Georgia: Moderate | 1 in 43 (2.3%)
•	Hawaii: Very High | 1 in 24 (4.1%)
•	Illinois: Very Low | 1 in 122 (0.8%)
•	Louisiana: High | 1 in 35 (2.8%)
•	Mississippi: Very High* | 1 in 23 (4.3%)
Columns on the right estimate the percentage chance that anyone is infectious in rooms of 10, 25, 50, or 100 people (e.g., Arizona shows a >99% chance in a room of 100). A footnote states that on August 14, 2026, the CDC revised categorical descriptors downward without notice or rationale.
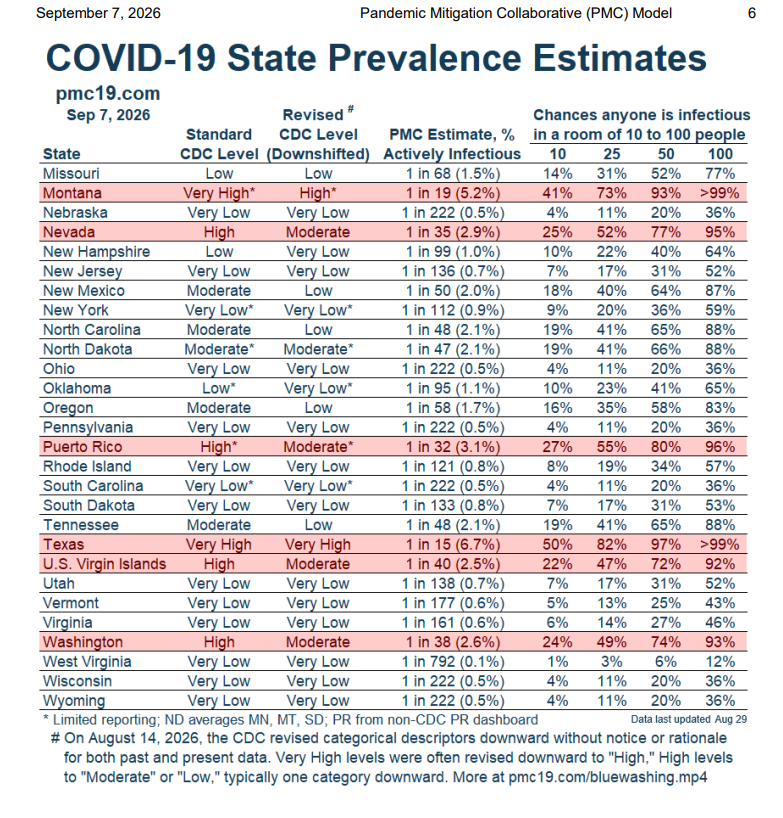
A data table titled "COVID-19 State Prevalence Estimates" from pmc19.com, dated Sep 7, 2026 (page 6). This continues an alphabetical listing of U.S. states and territories, evaluating CDC levels alongside PMC transmission models.
Selected State Metrics (State | CDC Level | PMC Active Infection Odds):
•	Missouri: Low | 1 in 68 (1.5%)
•	Montana: Very High* | 1 in 19 (5.2%)
•	Nevada: High | 1 in 35 (2.9%)
•	New York: Very Low* | 1 in 112 (0.9%)
•	Ohio: Very Low | 1 in 222 (0.5%)
•	Pennsylvania: Very Low | 1 in 222 (0.5%)
•	Puerto Rico: High* | 1 in 32 (3.1%)
•	Texas: Very High | 1 in 15 (6.7%)
•	Washington: High | 1 in 38 (2.6%)
•	West Virginia: Very Low | 1 in 792 (0.1%)
Columns on the right track transmission risk within groups. For instance, Texas shows a 50% chance that someone is actively infectious in a room of 10 people, jumping to >99% in a room of 100 people. A footnote calls out unexplained downward CDC classification shifts.