In reply to @anxiouscatmom

I hate it here.

I hate it here.

@anxiouscatmom · Twitter ·

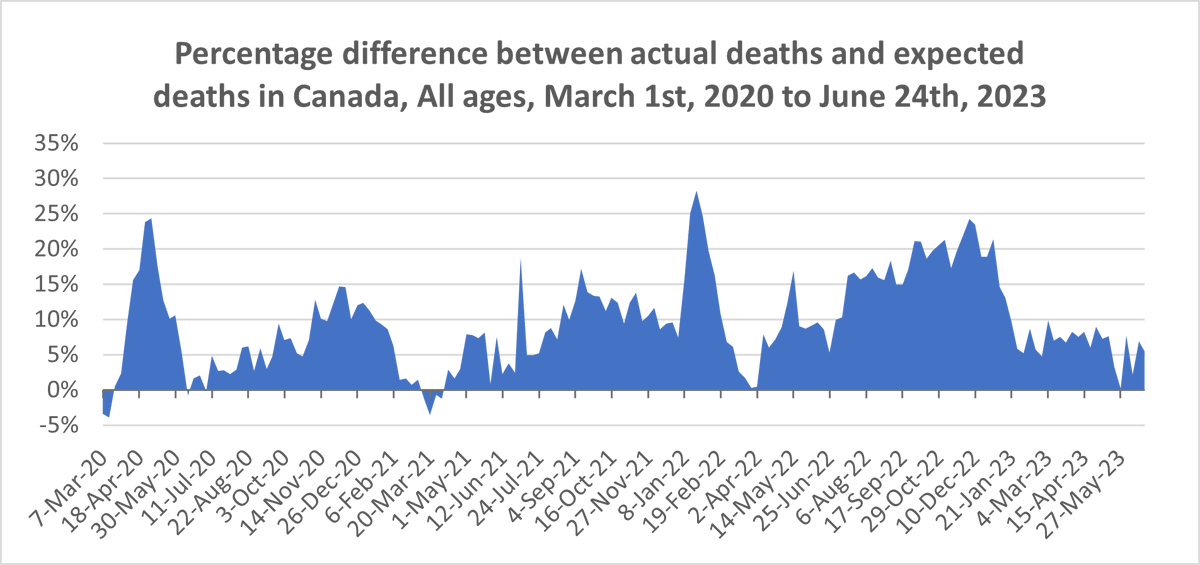
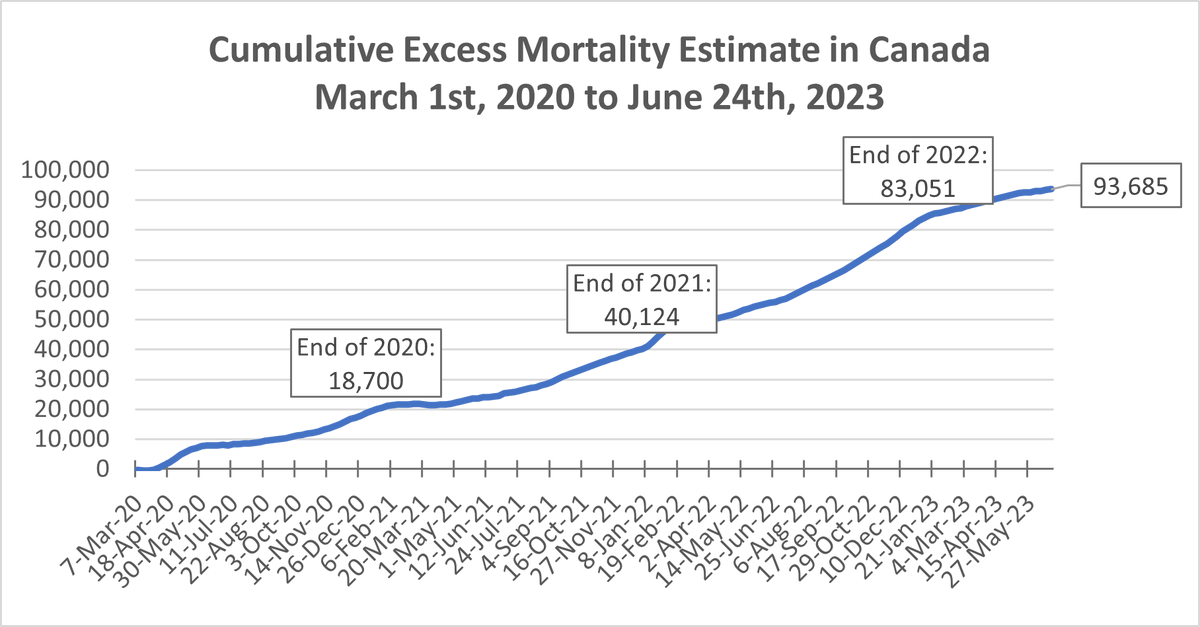
Anyways, here is weekly deaths plotted against expected deaths, weekly excess mortality (the difference), weekly % excess mortality (excess mortality as % (/+ expected) and cumulative excess mortality (running total of weekly excess mortality)
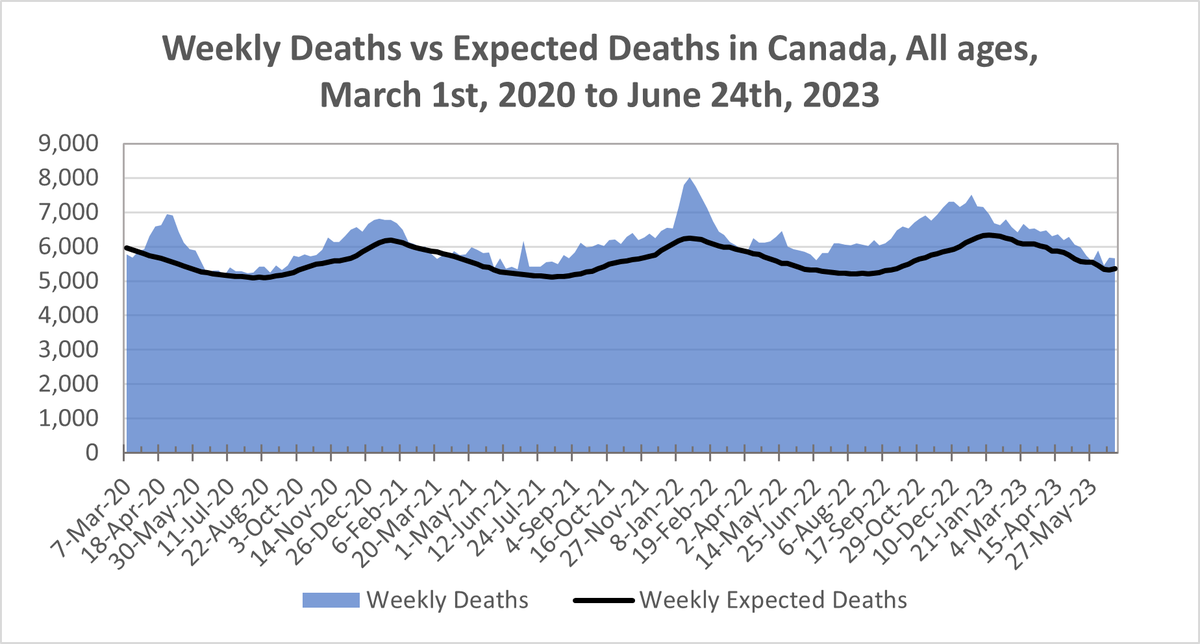
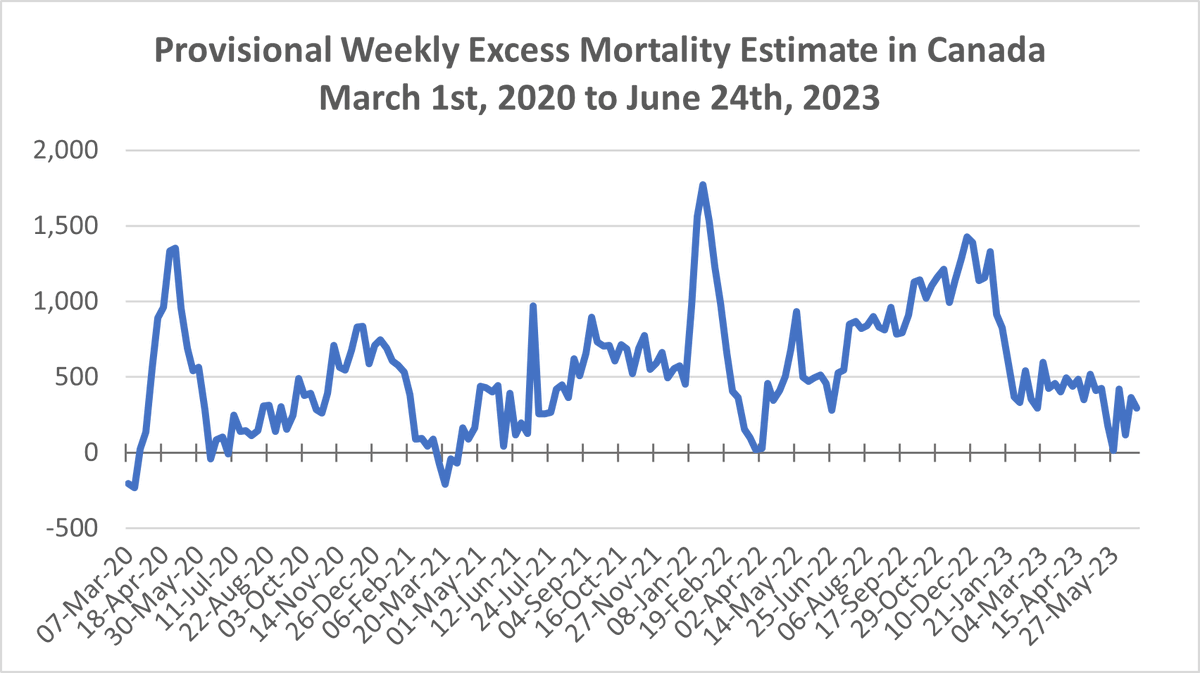
Chart showing weekly deaths (as shaded blue area) vs weekly expected deaths (as black line) in Canada for those of all ages between March 1st, 2020 and June 24th, 2023. Expected deaths fluctuate between around 5,100 and 6,400. Actual deaths fluctuate between 5,100 and 8,000. Line chart showing weekly excess mortality in Canada from March 1st, 2020 to June 24th, 2023. The figure is above 0 for the most part (indicating more deaths than expected) with small dips below 0 in early March 2020 and March 2021. The figure peaks around 1,400 in May 2020, 1,750 in January 2022, and 1,500 in December 2022, dropping off steeplyto around 500 in 2023, where data is still accumulating. Chart showing weekly % excess mortality from March 1st, 2020 to June 24th, 2023 in Canada, for all ages. The figure is largely above 0, with small dips below 0 in early March 2020 and March 2021. The figure peaks around 25% in Spring 2020, 15% in Fall-Winter 2020, 18% in Summer 2021 (very briefly), and again in Fall 2021, 28% in January-February 2022, 15% in Spring 2022, nearly 25% in November 2022, then drops to around 5% during 2023, likely due to data still accumulating. Chart showing cumulative excess mortality in Canada from March 1st, 2020 to June 24th, 2023, with figures at the end of each year and the most recent available week indicated. The trend is a fairly straight line, with subtle bumps each January. There were 18,700 excess deaths by the end of 2020, 40,125 at the end of 2021, and 83,051 at the end of 2022, and 93, 685 by June 24th, 2023.