In reply to @anxiouscatmom

I hate it here.

I hate it here.

@anxiouscatmom · Twitter ·

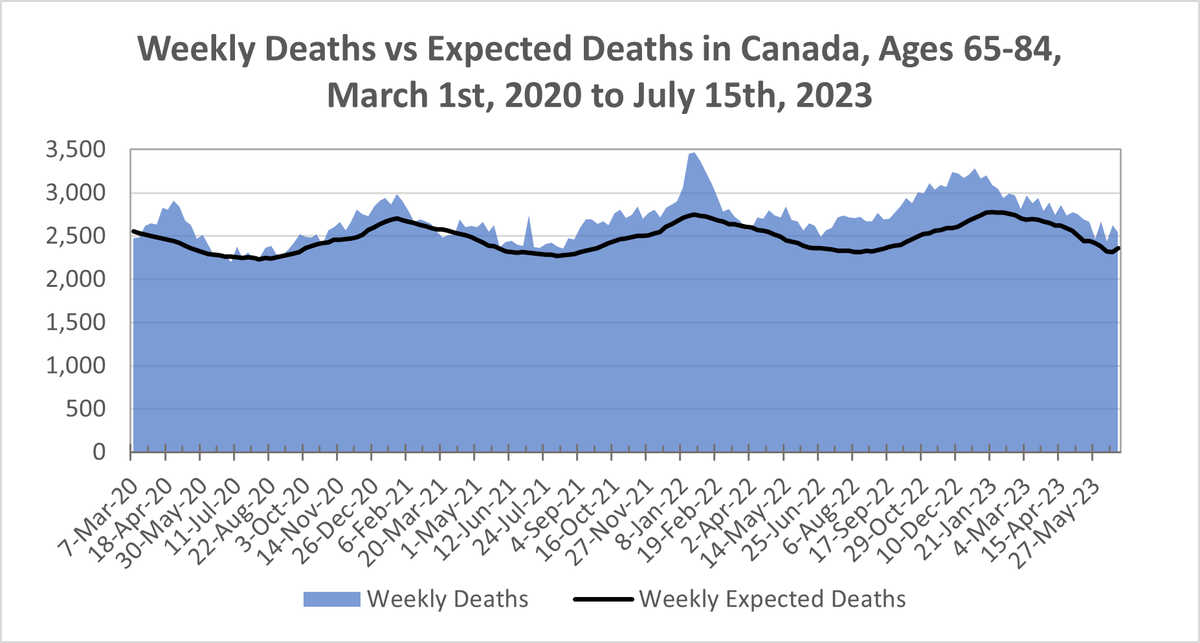
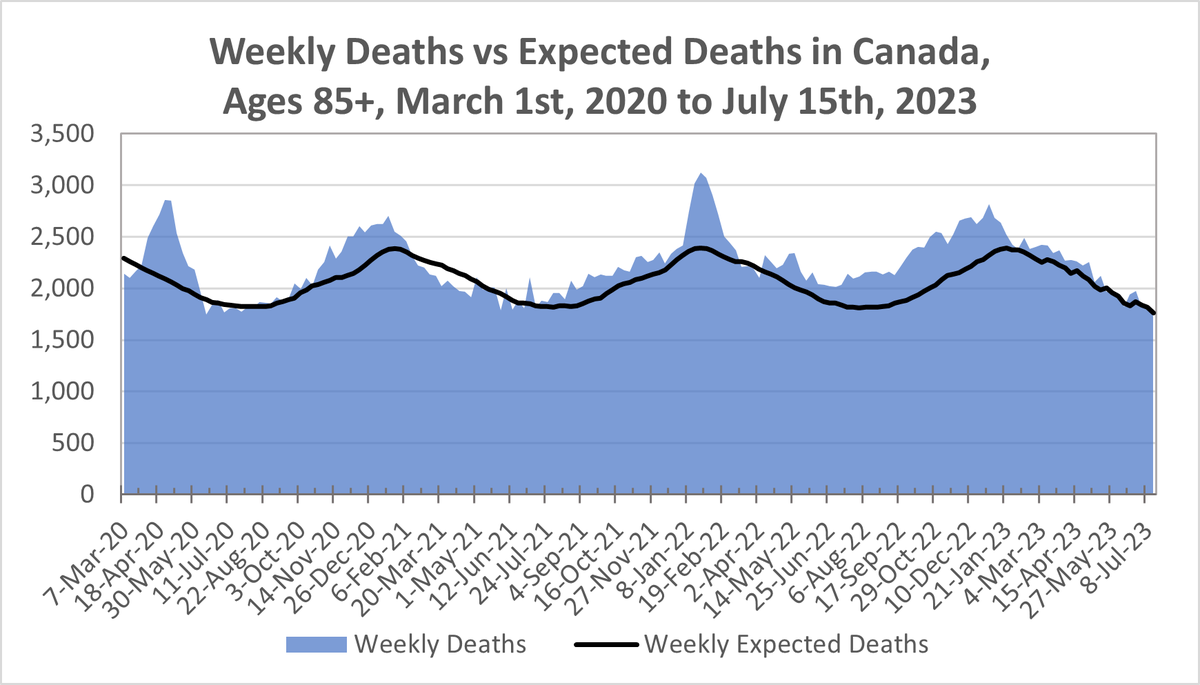
And here is weekly weaks vs expected deaths for each age group. Data was only available to June 24th for ages 0-44 and up to July 15th for other age groups so that is why end dates differ. If you see June 3rd though.
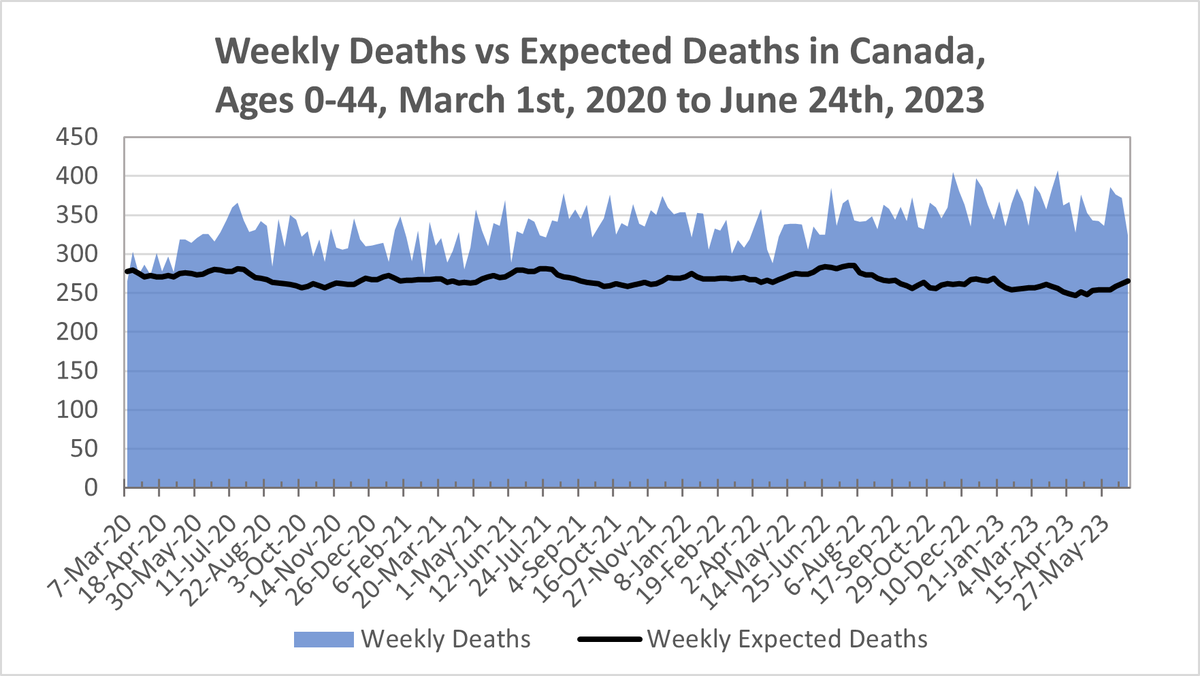
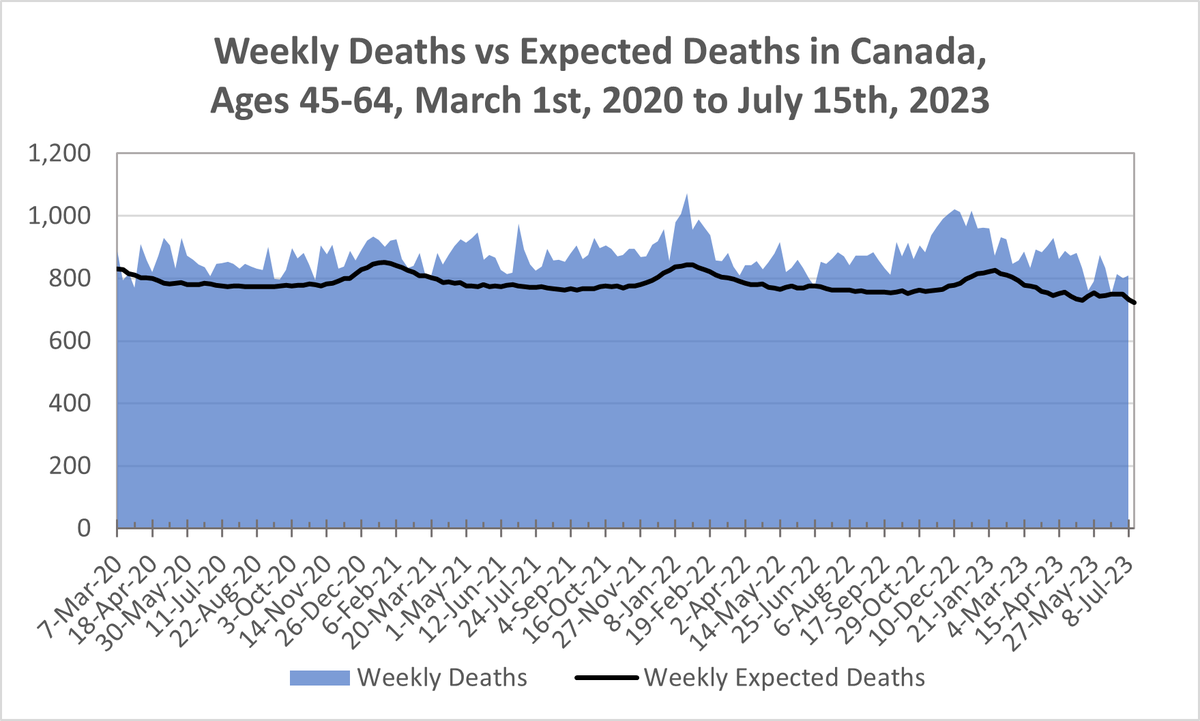
Chart showing weekly deaths (as shaded blue area) vs weekly expected deaths (as black line) in Canada for those aged 0-44 between March 1st, 2020 and June 24th, 2023. Expected deaths fluctuate between around 250-290. Actual weekly deaths range from 270  and 400, surpassing expected deaths by increasing amounts over time. Chart showing weekly deaths (as shaded blue area) vs weekly expected deaths (as black line) in Canada for those aged 45-64 between March 1st, 2020 and July 15th, 2023. Expected deaths fluctuate between around 730-850. Actual deaths range from 730 to 1,000. Chart showing weekly deaths (as shaded blue area) vs weekly expected deaths (as black line) in Canada for those aged 65-84 between March 1st, 2020 and July 15th, 2023. Expected deaths fluctuate between around 2,200-2,800. Actual deaths fluctuate between 2,200 to 3,500. Chart showing weekly deaths (as shaded blue area) vs weekly expected deaths (as black line) in Canada for those aged 85+ between March 1st, 2020 and July 15th, 2023. Expected deaths fluctuate between around 1,800 and 2,400. Actual deaths fluctuate between 1,700 to  3,100.