Bean & Sprout's Mom

Bean & Sprout's Mom

@beansprouts_mom · Twitter ·

The number of excess deaths age 0-44 in 🇨🇦 haunts me, too. What. Are. We. Doing 😱

I hate it here.

I hate it here.

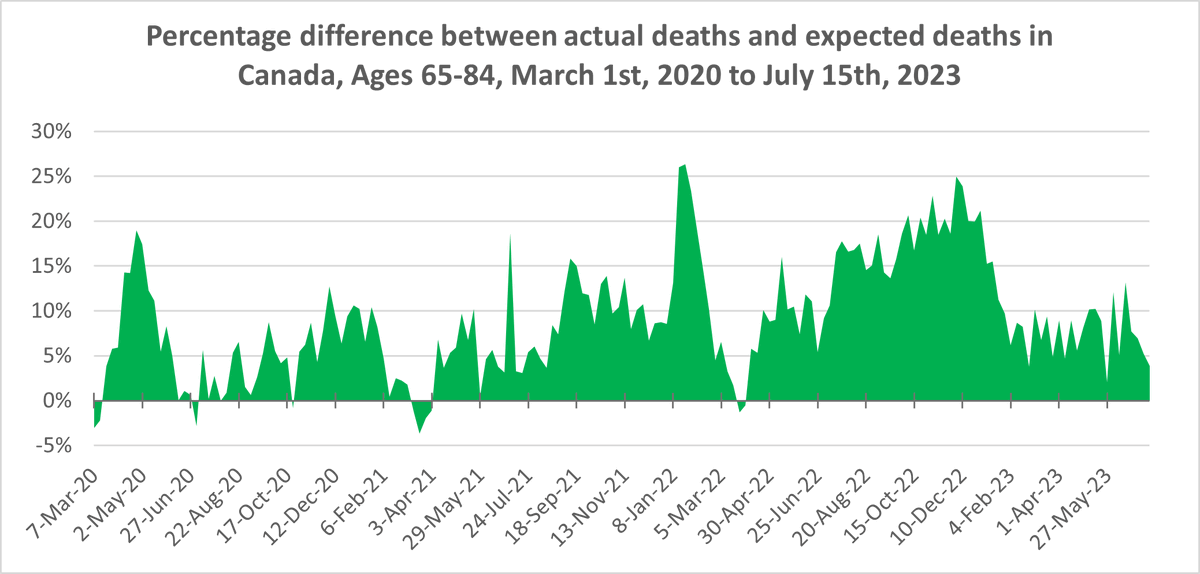
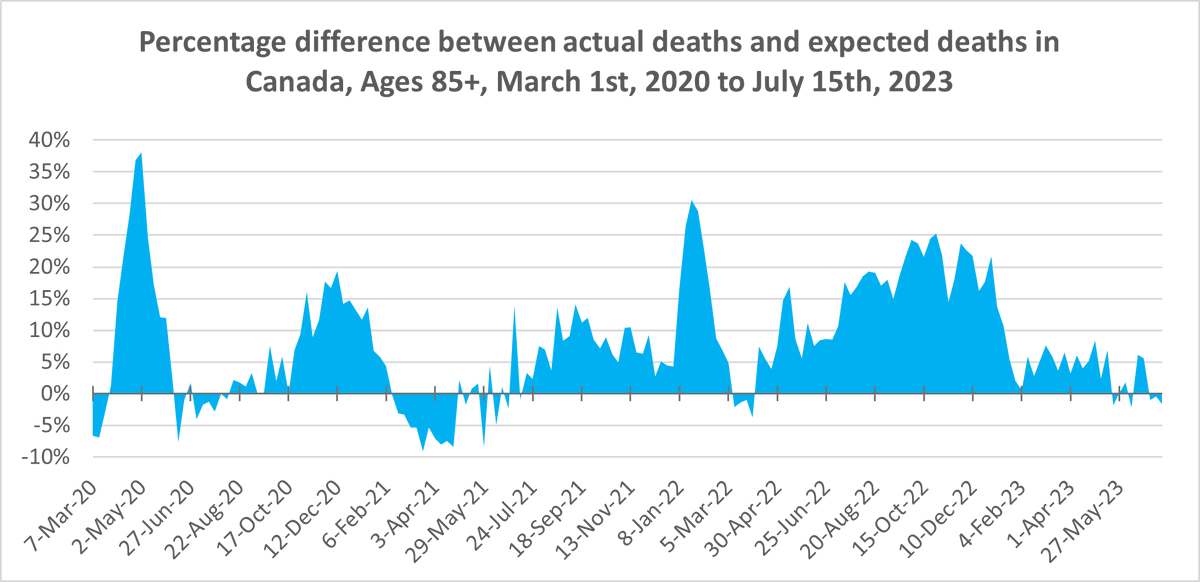
Here is percentage excess mortality for each age group. (i.e. weekly deaths as a percentage above/below the number expected) The 0-44 chart haunts me. Note the differing y axis scale between charts.

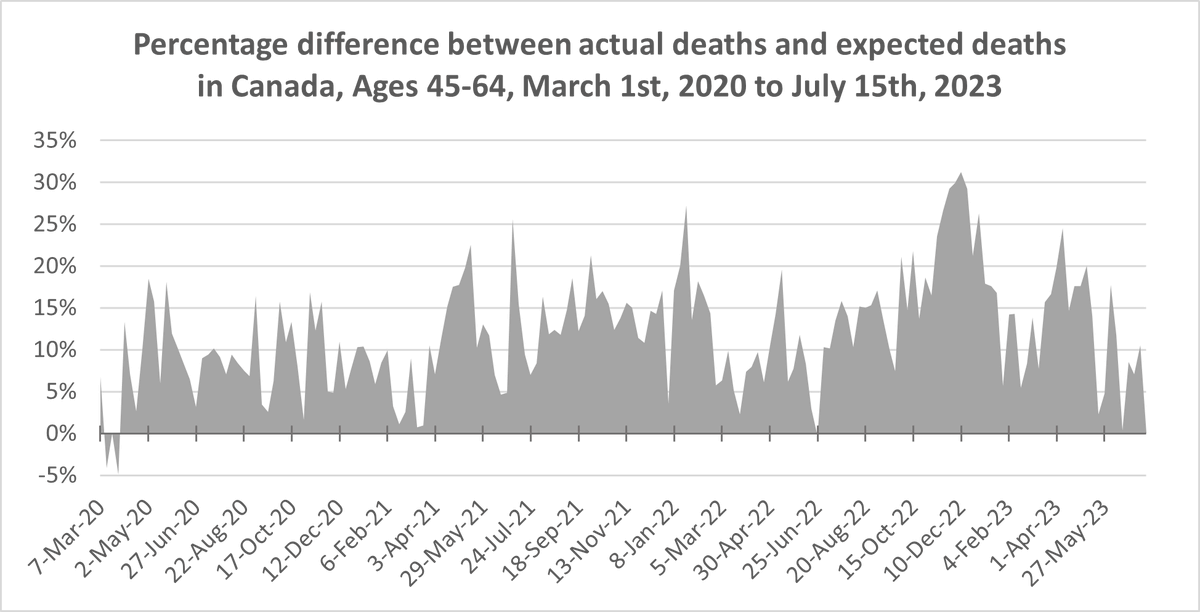
Chart showing weekly % excess mortality from March 1st, 2020 to June 24th, 2023 in Canada, for ages 0-44. The figure is consistently above 0 and generally very high, with some waves but less of a smooth pattern than the all ages chart. The figure peaks around 33% in Fall 2020 and in Spring 2021, 45% in Fall 2021, 35% in Spring 2022, 55% in Fall 2022 and in Spring 2023, with the most recent week at 22%. Chart showing weekly % excess mortality from March 1st, 2020 to July 15th, 2023 in Canada, for ages 45-64. The figure is above 0 aside from a slight dip below zero in early March 2020. The figure peaks around 18% in Spring 2020, 15% in Fall 2020, 25% in Summer 2021 and in January 2022, 18% in Spring 2022, 30% in November 2022, and 25% in Spring 2023, with the most recent week around 10%. Chart showing weekly % excess mortality from March 1st, 2020 to July 15th, 2023 in Canada, for ages 65-84. The figure is above 0 aside from a slight dip below zero in early March 2020, briefly in Summer 2020, March 2021, and March 2022. The figure peaks around 18% in Spring 2020, 13% in November 2020, 18% in Summer 2021 (very briefly), over 25% in January 2022, 15% in Spring 2022, 25% in December 2022, then fluctuates around 10% in 2023. Chart showing weekly % excess mortality from March 1st, 2020 to July 15th, 2023 in Canada, for ages 85+. The figure is above 0 aside from  relatively small dips in early Spring and Summer 2020, March to May 2021, March 2022, and Summer 2023 where data is still accumulating. The figure peaks around 38% in Spring 2020, 20% in December 2020, 15% in Summer 2021, 30% in January 2022, 25% in Fal to Winterl 2022, then hovers around 5% in 2023, likely due to data accumulating.
Post media