Mike Hoerger, PhD MSCR MBA
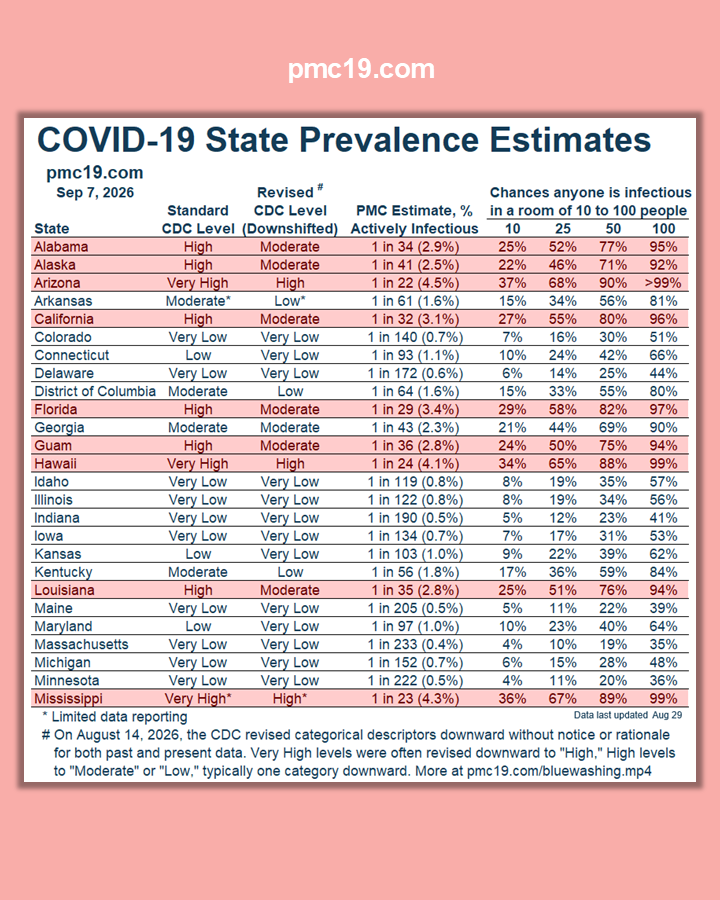
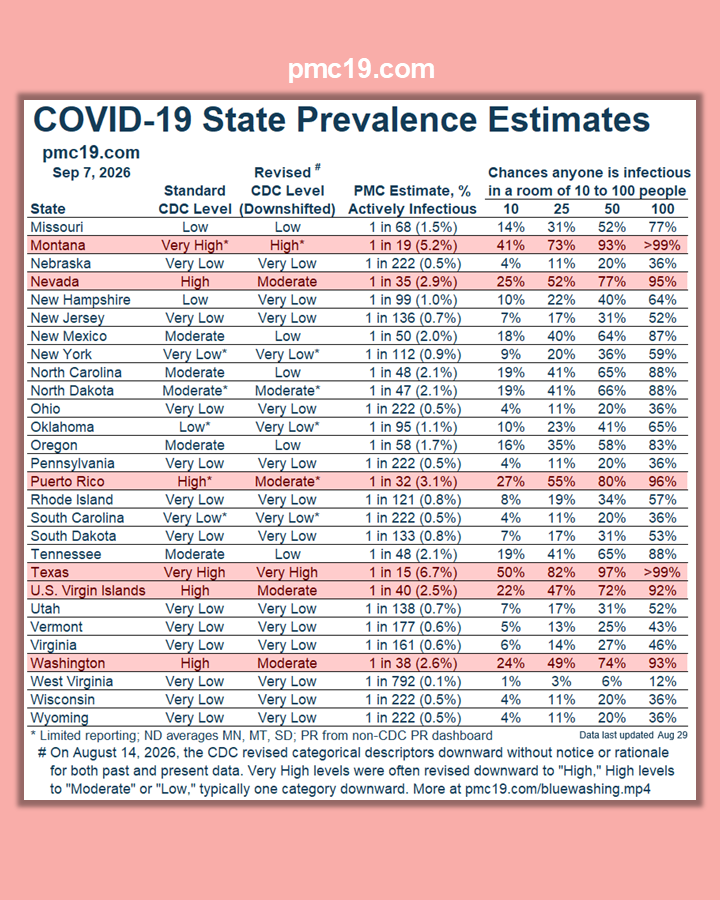
The CDC recently downshifted the categories and colors it uses to describe all current and historical COVlD levels. Our state stables show both, and the interactive map allows you to toggle to the version you prefer. THREAD (5/5) 🧵 https://x.com/michael_hoerger/status/2089089290089181242
Mike Hoerger, PhD MSCR MBA
🚨BREAKING 🦠 On Friday, the US CDC arbitrarily shifted higher COVlD levels into lower categories depicted with cooler colors. Much of what was Very High is now "High." What was High is now "Moderate" or "Low." Low is "Very Low." 🔹2 states/territories artificially shifted from High to Moderate (MS, GU) 🔹5 shifted from Moderate to Low (CA, TX, AK, WA, NV) 🔹4 shifted from Low to Very Low (AZ, AR, LA, NC) During intense surges, states will rarely get classified as Very High anymore. Presently, transmission is rising across the US, with a 75% chance of a wave, but states will be depicted in blue (Very Low) much longer, making communities less prepared. #Bluewashing Normally, when the CDC makes a methodology change, they flag it prominently on each of their COVlD monitoring pages. This time, there was no alert and no explanation. Major changes were confined to COVlD, not Influenza A, and not RSV. The questionable change was made in the middle of rising transmission across most of the country; 15 states already have COVlD outbreaks, and others may soon join the ranks. These are serious ethics concerns that warrant investigative journalism. These issues are aggravated by delayed reporting at High/Very High monitoring sites. Sites with 1-week reporting delays get excluded when the CDC calculates current levels. For example, only 16% of the sites online in Texas (3 of 19) report High/Very High levels, but 90% of those with a 1-week reporting delay (18 of 20) have High/Very High levels, leading the state to get classified as "Low" when really High. These issues snowball and can easily push a state down 1-2 categories when experiencing significant COVlD outbreaks. The good news is that the individual wastewater monitoring site data are still valid. The bad news is that the CDC maps and level descriptions will now mislead the casual user. Think: "Good data, bad use of data." At PMC, we told you that if there was any funny business at the CDC, we would warn you right away. We diagnosed the issue immediately and will still report accurate COVlD information. Expect further national news coverage this week. Journalists are welcome to reach out.